Voronoi Experiments
Published .
Tags: art-and-design, math
I was poking around in a directory of my old code the other day and found an old Voronoi diagram generator.
A Voronoi diagram looks kinda like this:
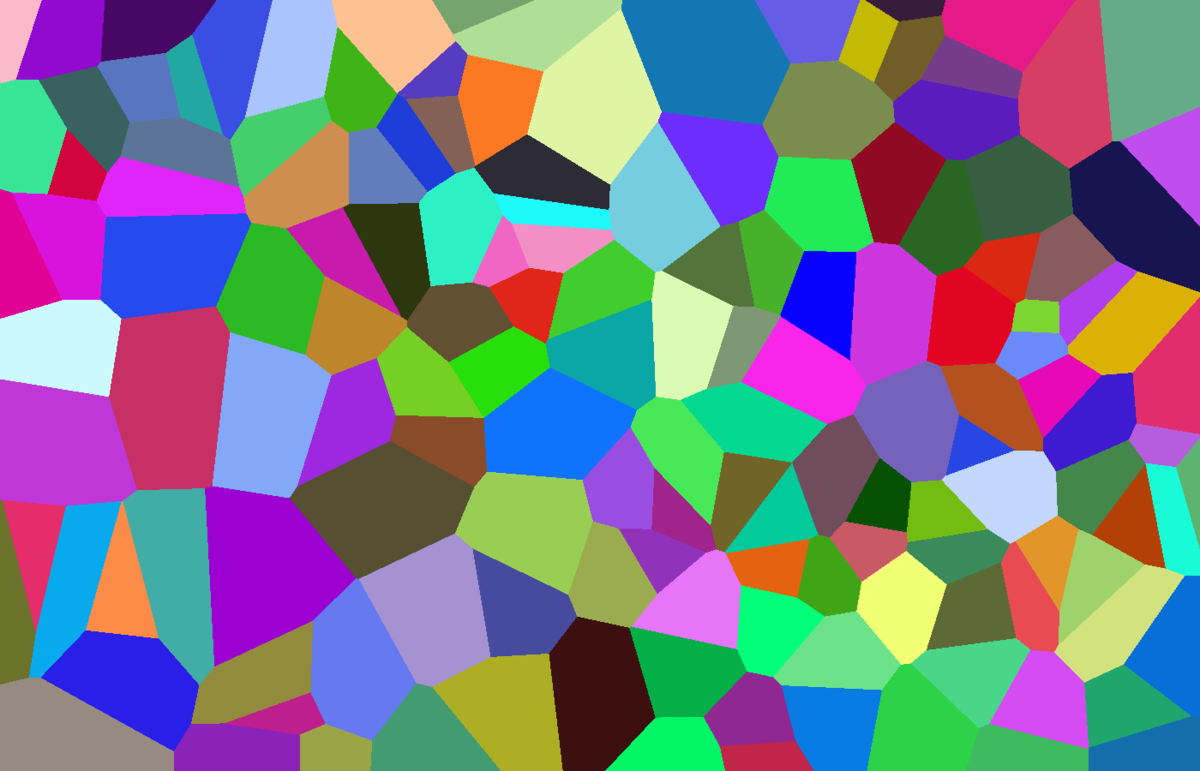
Here’s how you generate one:
- Pick a series of random points in the plane. Let’s call these points centroids.
- For every other point in the plane, find its nearest centroid. Call the set of points associated with a given centroid a cluster.
- Assign a color to every cluster.
This algorithm as we’ve described it is extremely inefficient, but it’s easy to reason about. There are also some exremely clever ways to generate Voronoi diagrams more efficiently (Fortune’s algorithm uses properties of parabolas to manage it in \(O(n \log n)\), for example).
However, if we stick with the inefficient implementation, we can easily vary the definition of distance. Normally we’d use Euclidean distance, but we can pick any distance metric that we’d like. Here’s one that was generated using Manhattan distance:

Both Euclidean and Manhattan distance are just special cases of Minkowski distance, where \(p\) has been set to 2 or 1, respectively.
Here’s the case where \(p = 3\):

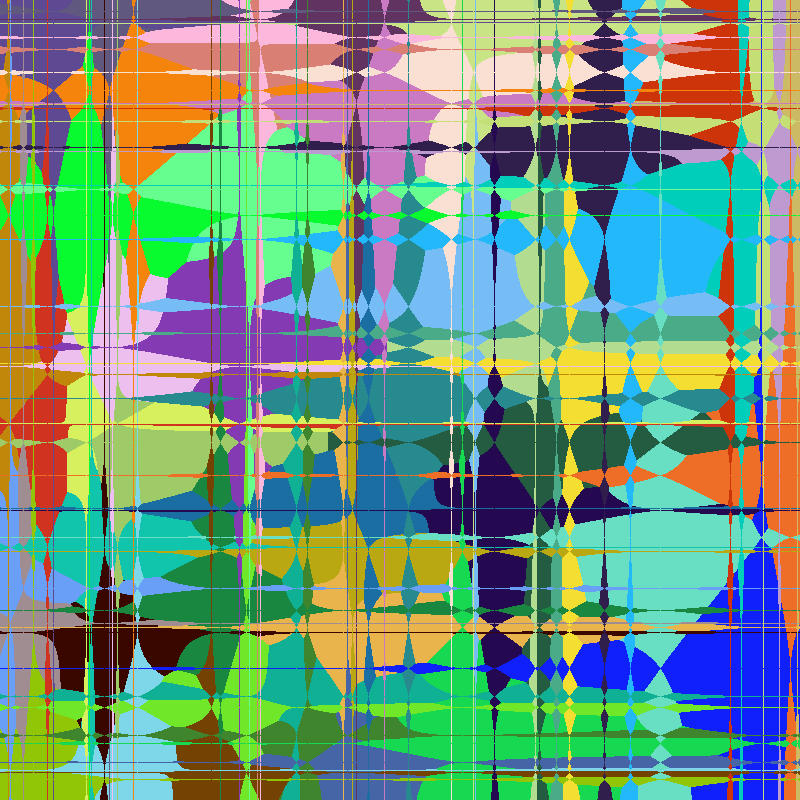
And \(p = 0.5\):

And \(p = 0.1\):
Anyway, just a fun little experiment.